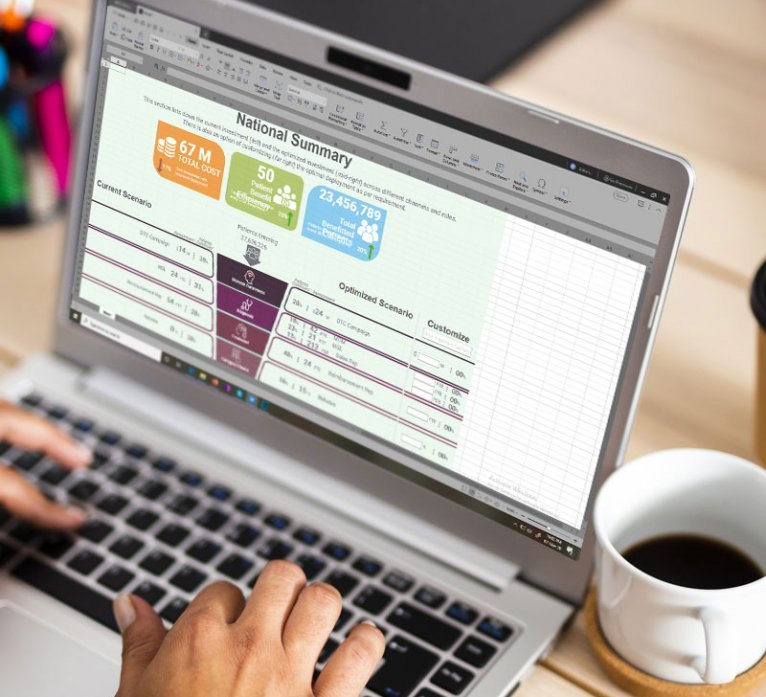
The biggest success of this project was not only simplifying user interactions of an overwhelming system, but also making output analysis easy and intuitive.
Matrix is an Excel based tool, that could be used to predict required investment for promotion of a pharmaceutical product. It could do that by predicting drops at various stages of patient journey and suggesting preventive measures.
Named after the famous movie for its complexity and artificial intelligence, it was a large tool, spanning several sheets for data input and two complex output sheets. The main requirement of client was to simplify the user interface. Clearly it was much more than that, I conducted UX workshop understanding the entire system, its purpose and the target users. I redsigned the information architecture, designed input templates, created low fidelity wireframes for concept proposal, and a high fidelity prototype.
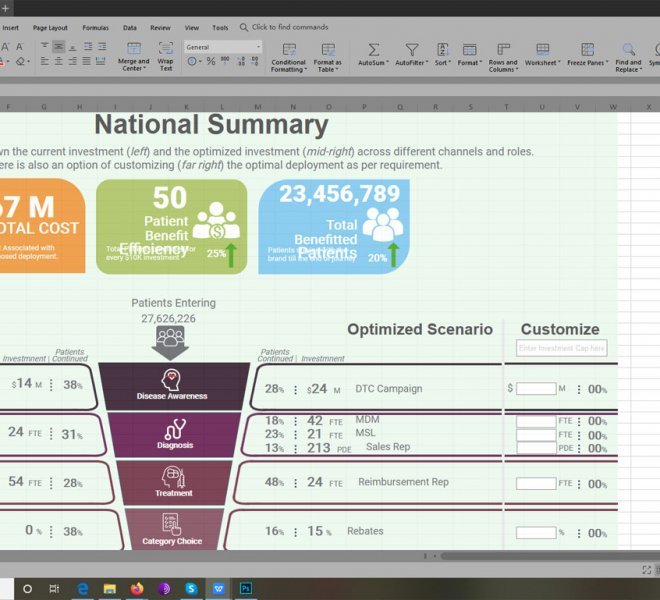
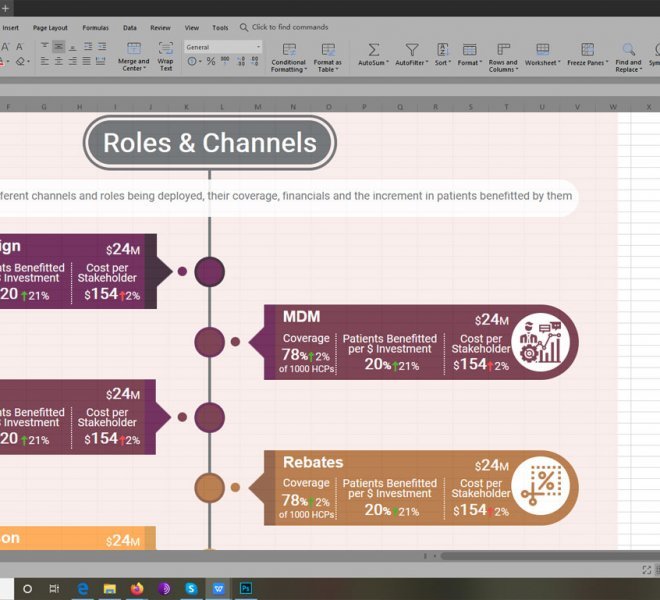
The tool being created using VB, we had ample opportunity to come up with creative solutions. I simplified the system by unifying redundant data, and modifying data input process to form based input. I also modified the complex tabular output to infographic representation making it easy for the user to quickly analyse the information.
Features
Comes with three different views to display the campaign spread across a week, month, or a year.
Comes with three different views to display the campaign spread across a week, month, or a year.
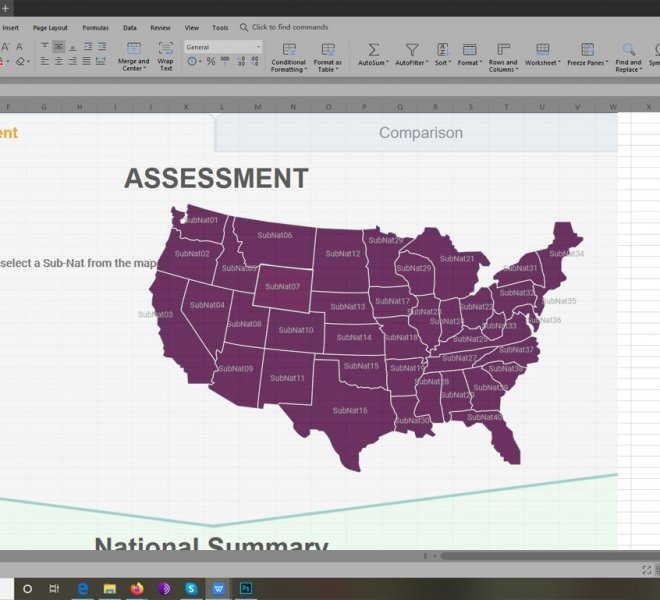
Investment comparison for multiple permutation combinations of product, regions and scenarios.
